California New Car Dealers Association Releases Third Quarter 2023 Auto Outlook
Contact: Autumn Heacox, Communications & Marketing Director: aheacox@cncda.org, (916) 441-2599 x105
California 3Q 2023 Auto Market Recap: Registrations Continue to Rise
New EV Models Contribute to 14.3 % Sales Increase YTD
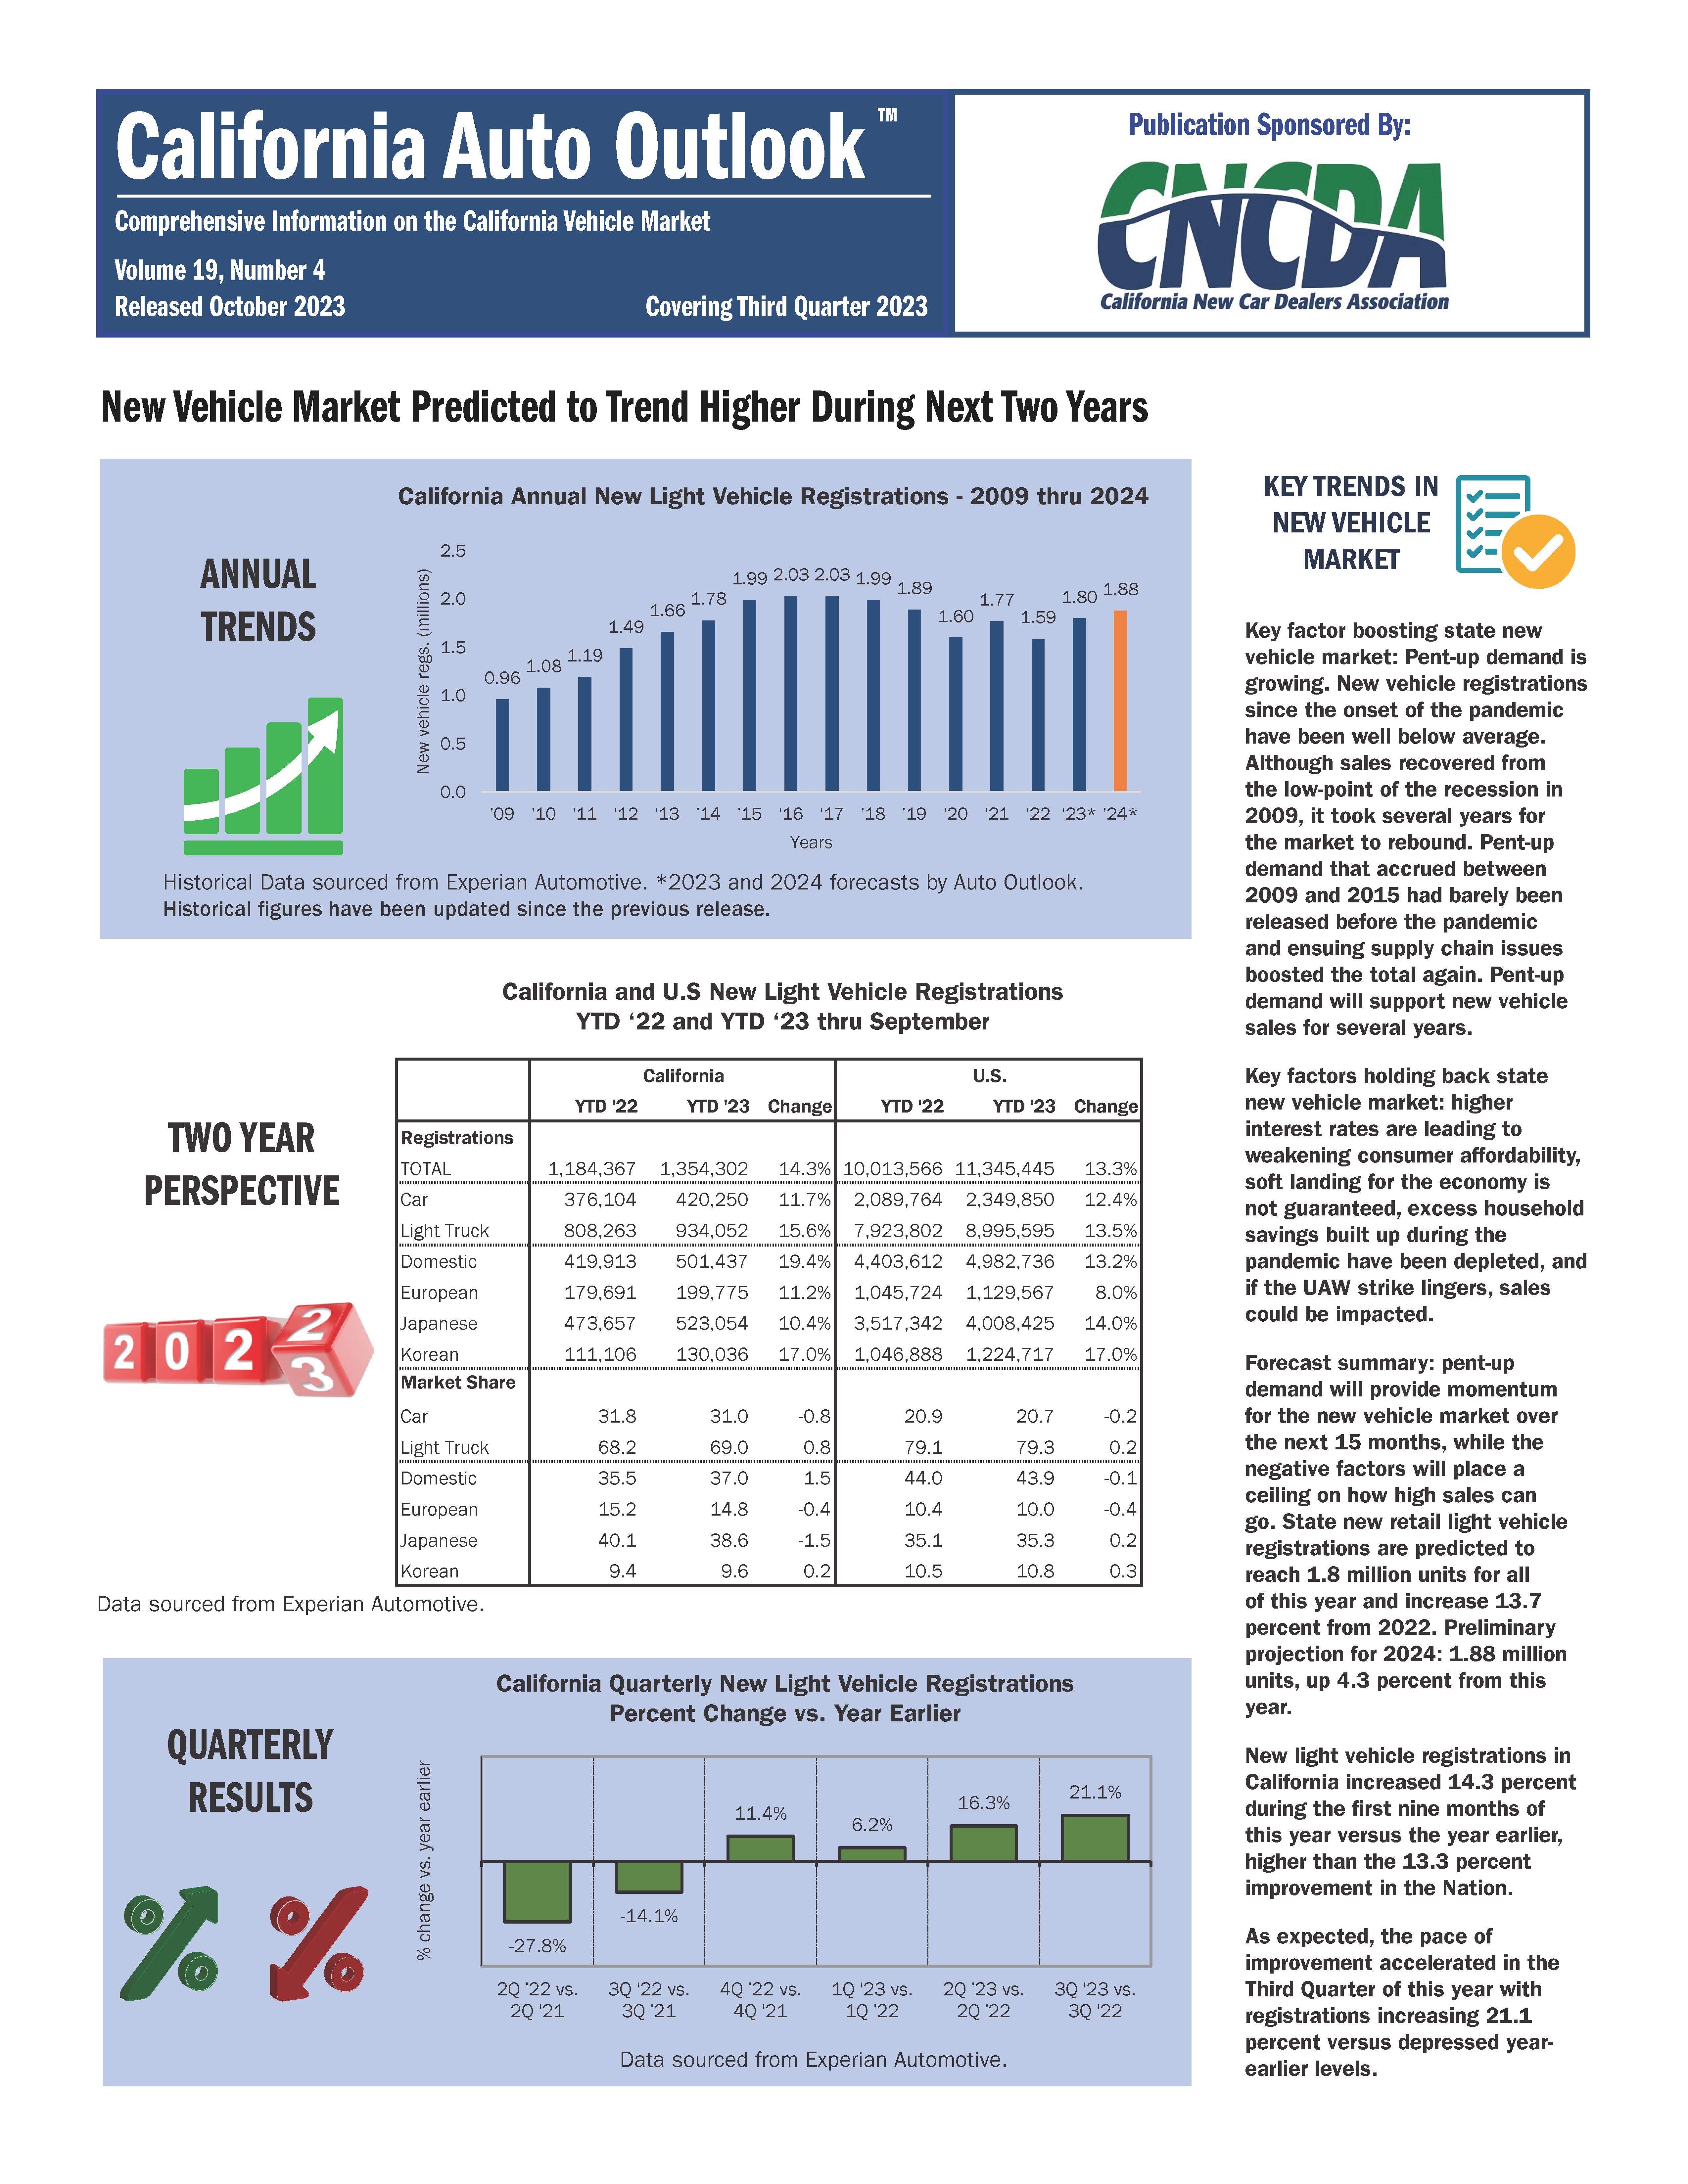
SACRAMENTO, CA, November 1, 2023 – The third quarter 2023 Auto Outlook report, published today by the California New Car Dealers Association (CNCDA), reveals a 14.3 percent increase in California’s new vehicle registrations compared to the first nine months of 2022. Forecasts from the Auto Outlook report show that California will end the year at 1.8 million new vehicle registrations and is predicted to reach 1.88 million in 2024. CNCDA’s historical Auto Outlook data is sourced from Experian Automotive. Click here to access the full report.
Pent-up demand remains high since the pandemic and is estimated to continue to support new vehicle sales for years to come. However, high interest rates leading to weakening affordability, depleted pandemic-built household savings, and the potential UAW strike after effects will be major factors in impeding the state’s new vehicle sales. That said, California’s Q3 2023 new car registration numbers are a full percentage point better than the national results, which yielded only a 13.3 percent improvement vs 2022.
A promising sign: the pace of new car sales showed a significant acceleration in Q3 with an increase of 21.1 percent YOY, versus last year’s Q3 numbers which showed a decline of 14.1 percent.
New to this Auto Outlook report: a more robust breakdown of the state’s new battery electric vehicles (BEV) and plug-in hybrid (PHEV) sales and market health breakdown. The report now includes YTD and quarterly electric, hybrid, and PHEV sales numbers. Key figures: the state’s BEV market share increased to 21.5 percent during the first nine months of 2023. California’s total new BEV market share sales increased by half a percent from the first six months of this year.
While ICE-powered vehicles account for 64.6 percent of the state’s new vehicle sales share, sales were down from 71.6 percent in 2022. Sales of BEVs, PHEVs, hybrids, and fuel cell sales in the state accounted for a 35.4 percent share YTD (as compared with 11.6 percent in 2018).
“Meeting our customers’ needs, whether it’s continued demand for ICE vehicles, hybrids, or new EV options, is our top priority, and we are looking to expand our vehicle offerings.” says Tony Toohey, CNCDA Chairman and Owner of Auburn Toyota “As a local new car dealer, we want to offer our customers and community the variety of vehicle options they want at price points that meet their individual circumstances,” says Toohey.
Hybrids and Electric Vehicles
California leads the way in the shift towards new auto technologies, leading BEV registrations nationwide, with almost 35 percent of all sales. The report also shows a 103 percent increase in BEV vehicle sales this year from franchised dealers. Direct-to-consumer sellers (i.e., Tesla, etc.) showed a 42 percent increase in sales YOY.
California’s BEV market share remains at just over 21 percent in the first nine months of 2023. This is a significant difference from the nation’s BEV market share, which reaches only 7.4 percent of sales, YTD.
The Q3 report lists California’s top-performing BEV and PHEV makes and models. The top three selling BEV and PHEV models: Tesla Model Y, Tesla Model 3, and the Chevy Bolt. Fourth place was captured by the Jeep Wrangler (the best-selling PHEV on the list).
While Tesla continues to be the BEV market share leader in California, new numbers show their lead diminishing as traditional automakers roll out new electric vehicle models. Tesla showed a significant decline in sales at an 8.9 percent loss in share (when comparing YTD ’22 to ’23 numbers). Mercedes and BMW show the highest increases of BEV sales in California, picking up 2.6 and 2.5 percent of the share, respectively.
The Q3 market share leaders for exclusively PHEV makes were Jeep (capturing 29.8 percent), Toyota (at 17.6 percent) followed by BMW (at 12.8 percent).
So far this year, Northern Californians remain the larger adopters of BEVs, capturing 25.7 percent of the market share, while Southern CA BEV sales reported 21.1 percent of registrations.
Model Segment Rankings
California’s best-selling models for the first nine months in the primary segments remain the same as last quarter (and have increased/decreased their individual segment share by the following percents): Honda Civic (-.2), Toyota Camry (-.5), Tesla Model 3 (+2.4), Toyota Tacoma (-1.5), Ford F-Series (+.2), Toyota RAV4 (+.4), Toyota Highlander (-1.2), and the Tesla Model Y (-1.4).
Brand Market Share and Summary
Toyota remains California’s market share leader, holding 15 percent amongst all vehicle brands, followed by Tesla at 13.5 percent, Honda at 9.5 percent, Ford at 7.8 percent, and Chevrolet at 6.8 percent. Registration numbers increased by over 20 percent for Rivian, Buick, Tesla, Honda, Audi, Acura, Volvo, Chevrolet, Cadillac, Hyundai, Genesis, and Land Rover.
The state’s registration numbers do not mirror the rest of the U.S., which reports Toyota and Ford as the top-selling brands at 12.2 and 12 percent (respectively), followed closely by Chevrolet at 11.3 percent.
Brands showing the most significant positive change in registration numbers for Q3 ’23 compared to Q3 ’22 were: Rivian (176.8 percent), Buick (44.6 percent), Tesla (38.5 percent, and Honda (34.7 percent). Brands underperforming from last year: Dodge (-24.6 percent), Ram (- 15.8 percent), and Jeep (-6.7 percent).
Market Share Trends by Segment
SUV sales account for 53 percent of the California market in the first nine months of 2023, with non-luxury vehicles holding the majority share at 34 percent. This segment lost a point when compared to YTD 2022 numbers, while Luxury SUVs gained two points from last year at this time.
###
California Auto Outlook Quarterly is produced for CNCDA by Auto Outlook, Inc., an independent research company specializing in the analysis of statewide and regional automotive markets. When reporting these auto industry trends, please acknowledge the Data Source: Experian Automotive.
The report provides comprehensive information on CA’s new vehicle market, includes annual trends, a two-year perspective, vehicle powertrain dashboard, segment watch, the top models in each segment, brand scoreboards, regional comparisons, and more. Access the complete report at: www.cncda.org.
About CNCDA
For 99 years, the California New Car Dealers Association has represented California’s franchised new car and truck dealers and their interests. CNCDA members are primarily engaged in the retail sale and lease of new and used motor vehicles and provide automotive products, parts, services, and repairs. In 2022, California’s franchised new car dealers sold more than 1.6 million new cars and trucks, employed more than 136,000 people, paid $8.46 billion in sales tax, and donated $62.84 million to charitable and civic organizations. As the nation’s largest state association of franchised new car and truck dealers—with over 1,200 members—CNCDA provides legal compliance and legislative, regulatory, and legal advocacy.